Start by checking the local STR laws, since nothing else matters if rentals aren’t allowed. Then look at how similar listings perform: occupancy, nightly rates, seasonality, and competition. Run the numbers on your expenses and cash flow, and only buy if the returns clearly beat your target.
Before you buy anywhere, make sure short-term rentals are actually allowed in that area. Once you know they are, look at how similar listings really perform: how often they’re booked, what they charge, how busy each season is, and how many other hosts you’d be up against. Then add up what it will cost you, including the mortgage, property taxes, and cleaning, and work out your cash flow and return before you commit.
What is STR Market Research?

STR market research is how you find out if a place is worth buying in. You look at what similar Airbnb and Vrbo listings earn, how often they get booked, and whether the money left over is worth the risk.
Market research comes before property analysis. Ask “should I invest in this market?” first, and only then ask whether one specific property is worth buying. To research an Airbnb market properly, start with local rules, demand drivers, revenue, supply growth, and running costs, then see if the market fits your goals. Plenty of buyers skip this order and end up with a lovely house in a market that never fills it.
Start With Your STR Buy Box
Your buy box is a written list of what you want to buy and where, made before you open any data tool. It keeps your Airbnb market research focused and your comparisons fair.
- Use real numbers, not hopes
- Apply the same box to every market
- Cut markets that fail early
Without a box, every market looks decent. With one, you can say no fast and spend your time on the few places that fit.

Set Your Basic Criteria
These criteria turn a loose idea into a filter. Give each one a number or a clear choice, so every market gets judged by the same yardstick and not by how exciting it feels.
- Maximum purchase budget
- Minimum annual revenue you’ll accept
- Minimum cash flow you need
- Property type: condo, detached home, cabin, or multi-bedroom family house
- Bedrooms and target guest type
- Self-managing or hiring a manager
- How much seasonality you can handle
- Distance from home, if it matters
Keep budget and minimum cash flow as two separate rules. A market can fit your budget and still never pay what you need.
Choose the Market Type
Market type shapes who books, what they pay, and when they show up. Pick one type before you start, so you aren’t judging a ski town and a business district by the same numbers.
- Urban
- Beach or leisure
- Mountain
- Event-driven
- Family destination
- Business or corporate
- Mixed-demand
Each type has its own rhythm. Compare beach towns with beach towns, and you’ll learn a lot more.
Check STR Regulations Before You Study Revenue
Confirm the local short-term rental rules before you review revenue. Find out whether the area permits them, what zoning applies, and which licenses you need. A property that earns well on paper is useless if the law bars rentals.
- Are short-term rentals legal?
- Do you need a permit or license?
- Are there zoning limits?
- Is there an owner-occupancy rule?
- Must it be your primary residence?
- Is there a cap on rental nights?
- Is there a minimum-stay requirement?
- Do HOA or condo rules apply?
- What are the local lodging taxes?
Lodging taxes count twice. They’re a legal duty and a cost. Look at them here, then again when you estimate operating costs.
Look Beyond Current Rules
Today’s rules are only part of the picture. Read council agendas and minutes, proposed ordinances, recent enforcement changes, and permit caps or waiting lists to see where local policy is heading.
- City council agendas and minutes
- Proposed ordinances
- Recent enforcement changes
- Permit caps or waiting lists
A council discussion is a possible risk, not proof that a new rule will pass. Watch it, build it into your downside case, and confirm the final rules with the local authority before you make an offer.
Identify Why Guests Actually Visit the Market

The best market for Airbnb investment is rarely just a famous place. Strong STR markets usually have repeatable reasons for guests to visit all year, rather than relying on one short peak season.
“It’s a tourist city” doesn’t tell you much. Name the exact reasons people book, then check that those reasons come back every year.
Leisure Demand
Leisure demand comes from people traveling for fun. It’s often seasonal, so check how many months each attraction really keeps calendars full.
- Beaches
- Theme parks
- Skiing
- National parks
- Local attractions
A ski resort may be packed for four months and quiet for the rest. Know which one you’re buying into.
Business and Institutional Demand
This kind of demand is usually steadier, because the trips don’t depend on weather or holidays. It tends to fill midweek nights and brings longer stays.
- Hospitals
- Universities
- Corporate offices
- Convention centers
- Government facilities
Guests like these often book for work and need a quiet place, good Wi-Fi, and easy parking.
Event Demand
Event demand creates sharp spikes around certain dates. It can lift income, but treat it as a bonus on top of normal demand, not the reason you buy.
- Sports
- Concerts
- Festivals
- Conferences
- Weddings
Check a normal week with no event. If it’s empty, the market is leaning too hard on the calendar.
Prefer Multiple Demand Drivers
A market that depends on one annual festival is far riskier than one with tourism, business, university, and event demand together. More independent drivers mean fewer empty months, and less damage if one source dries up.
- One dominant driver: greater concentration risk
- Two or three independent drivers: potentially more resilient demand
- Multiple strong, independent drivers: less reliance on any single source
Analyze Airbnb Demand Using the Right Metrics
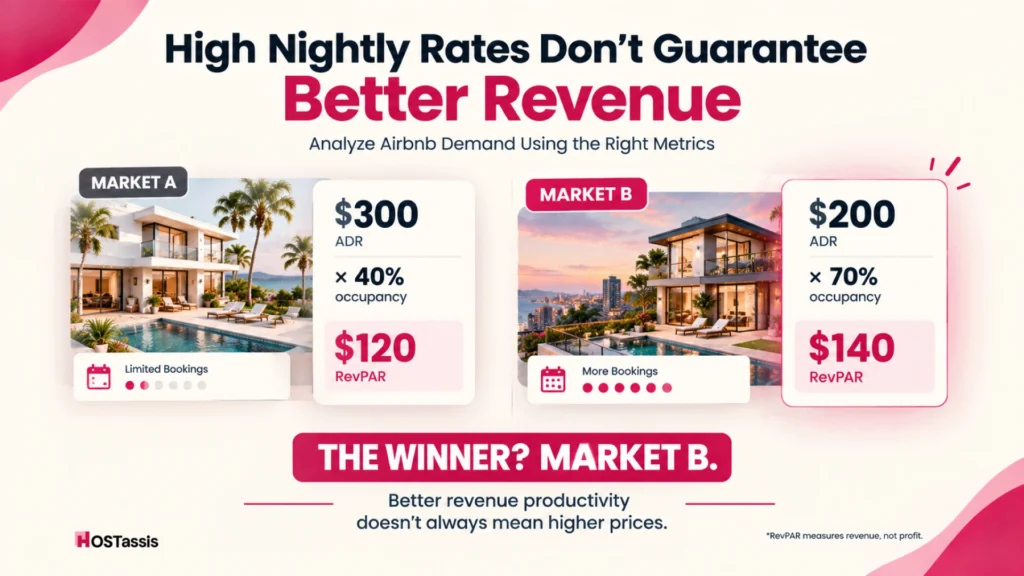
To judge short-term rental demand, look at several numbers together: occupancy, average daily rate, revenue per available night, and how far ahead guests book. Visitor counts or nightly prices alone can mislead you.
Short term rental market analysis works best when each number answers a different question. Price, bookings, timing, and stay length all shape what you’ll actually earn.
Average Daily Rate (ADR)
ADR is the average price guests pay for each booked night. It shows pricing power, but a high ADR with few bookings can still leave you with weak income.
- Compare it with similar properties only
- Check it month by month
Occupancy Rate
Occupancy is the share of available nights that actually get booked. The number depends on how the data provider counts available nights and listing availability, so it won’t match across tools.
- Stick to one data source when comparing
- Ask how blocked nights are treated
RevPAR
RevPAR is ADR multiplied by occupancy, written as a decimal. It shows revenue productivity, not profit, because cleaning, management, insurance, and taxes aren’t included. Check how your provider counts available inventory.
- Market A: $300 ADR × 0.40 occupancy = $120 RevPAR
- Market B: $200 ADR × 0.70 occupancy = $140 RevPAR
Market B comes out ahead even with the lower nightly rate.
Annual Revenue
Annual revenue helps only when you compare similar properties. Never line up different bedroom counts, property types, or locations, because a downtown studio and a five-bedroom cabin are different businesses.
- Compare the same bedroom count
- Compare the same property type and area
Booking Lead Time
Booking lead time tells you how far ahead guests reserve. Short windows make revenue harder to predict, especially outside peak season, because you wait longer to learn if a date will fill.
- Longer booking windows: provide earlier visibility into future demand.
- Shorter booking windows: may require closer monitoring of pickup and last-minute pricing.
Average Length of Stay
Average length of stay shows whether demand is weekend-heavy, weekly, or longer. Short stays mean more turnover and more cleaning cost than longer bookings, even when total revenue looks similar.
- Weekend stays: more cleans per month
- Longer stays: lower turnover costs
Seasonality
Seasonality means demand moves from month to month. Look at each month on its own, because a single annual average can hide long weak stretches that strain your cash.
- Find the top and bottom months
- Compare the gap between them
Study the Market Month by Month
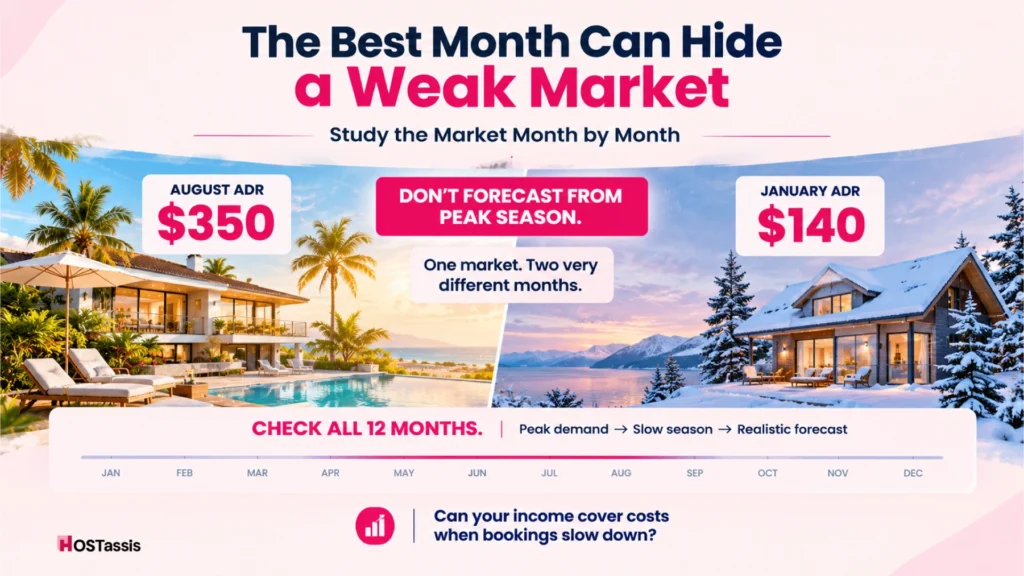
STR investors should analyze monthly revenue and occupancy because annual averages can hide severe seasonality. A solid forecast has to hold up in the weakest month, not only in the best one.
- When is peak season?
- What happens in the slowest month?
- How many months bring in most of the yearly revenue?
- Does demand fall hard in winter or summer?
- Are big events covering up weak normal demand?
Pull twelve months of ADR and occupancy for similar listings. Then ask a simple question: can the slow months still cover your fixed costs?
Don’t Underwrite From Peak Season
Peak-season rates aren’t your market rate. Build your forecast from the full year, or it will look great on paper and disappoint in your bank account.
- August ADR: $350
- January ADR: $140
If you use $350 as the “market nightly rate,” your forecast is unrealistic from day one.
Measure STR Supply and Saturation
Saturation happens when listings grow faster than guest demand. More tourism doesn’t help new hosts if supply climbs even faster, so track both sides before you buy.
- Active STR listings
- Listing growth
- New listings entering the market
- Bedroom mix
- Professional managers versus casual hosts
- Airbnb versus Vrbo share
- Supply by neighborhood
Numbers like these show who you’ll be competing with, and how crowded the field is getting.
Ask Whether Supply Is Growing Faster Than Demand
To test this, compare supply and demand over the same stretch of time. Use one consistent period, like the last 12 to 24 months, for every number below.
- Growth in active listings
- Change in booked nights or other demand signals
- Change in occupancy and ADR
- Differences by neighborhood and bedroom count
A market can pull in more visitors and still get worse for new hosts if listings grow faster than booked nights. Don’t treat tourism growth as proof that rental economics are improving.
Look for Underserved Property Types
Gaps in supply can point to opportunity. Look for the property type guests want that the market doesn’t have enough of.
- Hundreds of studios
- Many one-bedrooms
- Very few quality three-bedroom family homes
If group demand is strong, that last gap may be worth a closer look.
Research the Submarket, Not Just the City
A city-wide average can mislead you, because results change from one neighborhood to the next. Compare locations, access to demand drivers, and guest convenience before deciding where to buy.
- Neighborhood and ZIP or postcode
- Distance to demand drivers
- Walkability
- Parking
- Transit
- Waterfront or downtown access
- Safety and how guests see the area
Two streets apart can mean a different guest, a different price, and a different year.
Example: Two Neighborhoods, One City
Two areas in the same city can serve different guests and produce different economics. Match the area to the guest you want to host.
- Neighborhood A: walkable, near attractions, high ADR, limited parking
- Neighborhood B: cheaper homes, lower occupancy, family-friendly, free parking
Neither is wrong. They just need different strategies and different numbers.
Build a Relevant STR Comparable Set
A competitive set is the group of rentals your guests would weigh against yours. Pick listings in the same area with a similar bedroom count, price, and quality. Leave out the rest, even a house on the same street.
- Bedroom count
- Guest capacity
- Property type
- Location
- Amenities
- Quality level
Start narrow. You can widen the set later if you don’t find enough matches.
Study Both Average and Top Performers
Don’t only pick the highest-earning listings. Compare ordinary performers with strong ones, then work out what separates them before you assume you can match the best.
- ADR and availability
- Reviews
- Amenities
- Positioning
- Guest capacity
Ask why the top listings win. It could be location, amenities, photos, or fewer blocked dates. Some of that you can copy, and some you can’t. For the full method, see our Airbnb competitor analysis guide.
Validate the Numbers Outside STR Data Tools
Never trust a single dashboard. Check STR analytics against live listings, tourism data, search trends, real estate numbers, and local people, so errors show up before you’ve spent any money.
Data providers like AirDNA and Key Data publish guidance on supply, seasonality, and booking windows [add verified links]. Pair that with city regulation pages and tourism-board reports.
Airbnb and Vrbo Search
Search both platforms for your own dates. See how many similar listings are open, and note the price a guest actually pays, fees included.
- Open inventory for your dates
- Guest-facing totals
Tourism Data
Look at visitor volume, tourism growth, and event calendars. Rising visitor numbers support demand, but they don’t prove that rental income is rising too.
- Visitor counts
- Event calendars
Google Trends
Google Trends shows whether interest in a destination is seasonal, growing, or fading. Put it next to your monthly revenue data and see if they tell the same story.
- Seasonal pattern
- Long-term direction
Real Estate Data
Check purchase prices and long-term rental rates. If prices climb faster than rental income, your returns shrink even when bookings stay strong.
- Median purchase prices
- Long-term rental rates as a fallback
Local Sources
Talk to people who work in the market every day. A ten-minute call can uncover costs and problems that no chart shows.
- STR managers
- Cleaners
- Real estate agents
- Local hosts
Estimate the Real Operating Cost of the Market
Market revenue means little until you know what it costs to run a rental there. Local cleaning rates, taxes, insurance, and service needs can turn a strong gross number into a thin profit.
- Cleaning and laundry
- Utilities
- Insurance
- Property tax
- Lodging and tourist taxes
- Licensing
- Local management fees
- Repairs
- Landscaping, pool, or snow services where they apply
This is a market-level check, not a full property P&L. You just need a fair sense of cost levels. Don’t forget platform charges either. See how Airbnb’s host fee works before you build your cost estimate.
Compare Revenue Opportunity With Operating Complexity
Higher gross revenue often comes with more complexity. Compare what a market earns with what it takes to run before you get attached to the top-line number.
- Expensive cleaners
- Pool servicing
- Snow removal
- 25% local management
A lower-revenue market with simpler costs can pay you more in the end than a high-revenue market that eats its own income.
Stress-Test the Market Before You Trust the Revenue Forecast
A stress test shows whether a market still works when things go wrong. The real question isn’t whether the market has high revenue, but whether the investment stays viable when assumptions get less friendly.
Don’t only ask “what if everything goes right?” Run a few simple scenarios, and keep the same assumptions across every market you compare.
Base Case
The base case uses reasonable current performance. Build it from your comparable set and monthly data, not from the best listing you found.
- Typical ADR and occupancy
- Realistic operating costs
Downside Case
The downside case tests weaker conditions using the same assumptions as your base case. Run each change alone first, then combine them to see a realistic worst outcome.
- ADR falls 10%
- Occupancy drops
- Supply increases
- Cleaning and operating costs rise
Regulation Case
Rule changes can hit both revenue and feasibility. Ask whether the numbers still work if the rules get tighter.
- Permit costs increase
- Minimum-stay rules change
- Allowable rental nights decrease
The Basic Rule
If the investment only works under top-market assumptions, the market may be too fragile for your risk tolerance. Walk away, or look for a safer submarket.
- Works only in the best case: too fragile
- Survives the downside: worth a closer look
Compare STR With the Property’s Backup Strategy
Before buying, ask what happens if short-term renting becomes less attractive. A property with a workable plan B carries less risk than one that only makes sense as an Airbnb.
- Long-term rental
- Mid-term rental
- Owner use with limited STR
- Resale
Keep this check short. You’re not picking a new strategy, only making sure there’s a way out if rules or demand change.
STR Market Red Flags
Red flags are early warnings that a market may cost more than it pays. One or two can be managed. Several together usually mean you should keep looking.
- Regulations unclear or changing fast
- Revenue relies on one event or season
- Supply growing faster than demand
- Purchase prices rising faster than rental income
- Comparable properties with lots of open availability
- Top performers far ahead of the average
- Unusually high local operating costs
- Deal works only with optimistic ADR and occupancy
- Write down the flags you find. It’s easy to forget them once you fall for a property.
The HOSTassis 7-Point STR Market Scorecard
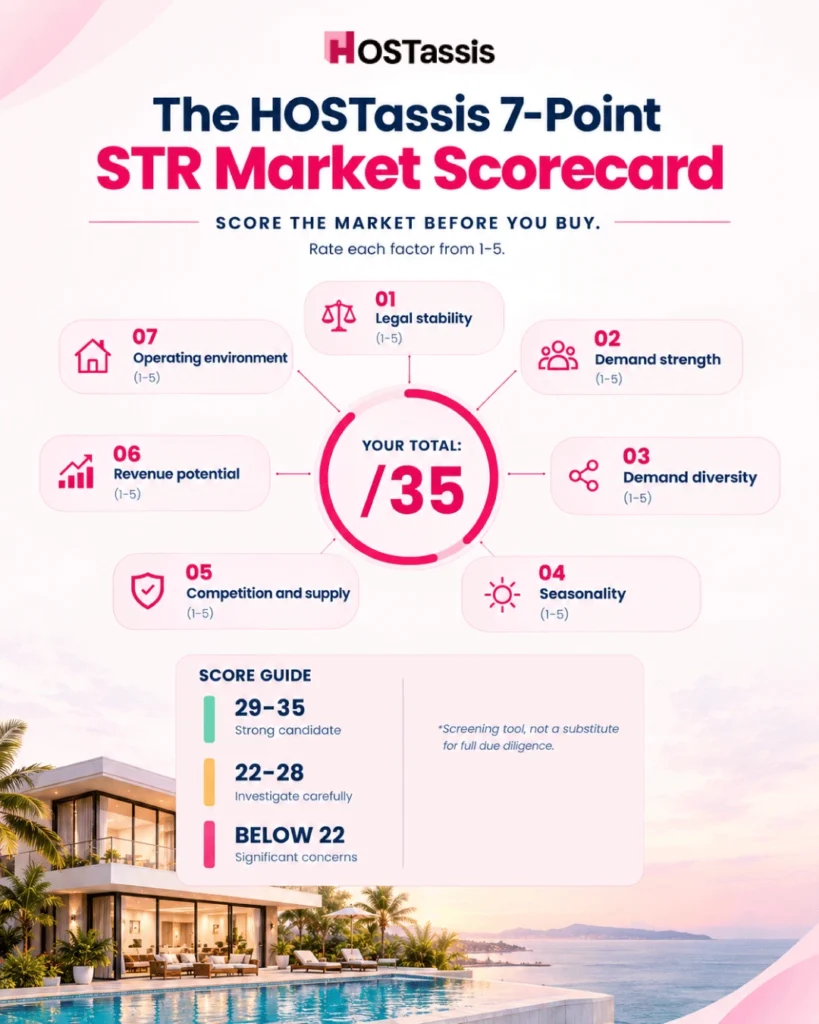
The HOSTassis 7-Point STR Market Scorecard rates seven factors from 1 to 5. Add them up for a quick screening result that lets you compare markets side by side before you go deeper.
Score honestly, and use evidence from your research for each factor. Guessing defeats the purpose.
1. Legal Stability
How clear and steady are the local rules for your property type?
- 1 = unclear or highly restrictive rules
- 3 = legal, but with material limits
- 5 = clear, workable, and fairly stable rules
2. Demand Strength
How much guest demand exists, and does the data back it up?
- 1 = weak or declining demand
- 3 = moderate demand
- 5 = strong, repeatable demand backed by market evidence
3. Demand Diversity
How many separate reasons bring guests here?
- 1 = one major demand driver
- 3 = a few meaningful drivers
- 5 = multiple independent sources of demand
4. Seasonality
How evenly does demand spread across the year?
- 1 = most income comes from one short season
- 3 = clear peaks, but acceptable off-season months
- 5 = steady demand through most of the year
5. Competition and Supply
Is supply under control compared with demand?
- 1 = supply growing much faster than demand
- 3 = supply and demand roughly balanced
- 5 = demand growing faster, with gaps in your property type
6. Revenue Potential
Does realistic revenue meet your buy box?
- 1 = well below your minimum target
- 3 = near your target in the base case
- 5 = comfortably above your target, even in the downside case
7. Operating Environment
How costly and complex is the market to run?
- 1 = high costs, heavy service needs, or hard-to-find help
- 3 = average costs with some added complexity
- 5 = reasonable costs and reliable local support
Total Score
- 29 to 35: Strong candidate for deeper property research
- 22 to 28: Worth investigating carefully
- Below 22: Significant concerns
This is a screening framework, not investment advice. It doesn’t replace legal checks or full financial underwriting.
What Should You Do After a Market Passes Your Research?
Once a market passes, work down in steps: choose submarkets, build a comparable set, identify the property type, then analyze individual deals. That keeps property analysis in its place.
- Market → select submarkets
- Submarket → build comparable set
- Comparable set → identify suitable property type
- Property type → analyze individual deals
- Deal → full financial underwriting, inspection, and financing and legal due diligence
This is where market research ends and property analysis begins.
Why Choose Airbnb for Short-Term Rental Investment?
Airbnb gives new hosts a large, ready audience, simple tools to list and manage a property, and a review system that builds trust. It is often the first platform investors use to test a market.
- Guests are already there. People search Airbnb when they plan a trip, so you don’t build an audience from zero.
- Setup is simple. Listing, calendar, messaging, and payments sit in one place.
- Reviews build trust. A few good reviews help a new listing win bookings.
- You set your own terms. Price, minimum stay, and house rules are yours to decide.
- It helps your research. You can see nearby listings, prices, and open dates before you buy.
Airbnb isn’t perfect, though. Host fees cut into income, competition can be heavy, and local rules still apply. Many hosts also list on Vrbo or Booking.com to spread the risk. If you do, learn how to match payouts from each platform to your reservations. Treat Airbnb as a strong starting point, not your only source of bookings.
STR Market Research FAQs
What is the most important metric for an STR market?
No single metric is enough. Look at ADR, occupancy, and RevPAR together with seasonality, supply growth, and local regulations to get a realistic view of how the market performs.
How do I know if the Airbnb market is saturated?
Watch for fast listing growth, lots of open availability among comparable properties, weak occupancy, falling prices, and tough competition between similar listings. These signs usually show up together.
How can I research the Airbnb market for free?
Use Airbnb and Vrbo search, tourism-board reports, government regulation pages, Google Trends, event calendars, and public real estate data. These free sources cover a lot before you pay for any analytics tool.
Should I invest in a market with high Airbnb occupancy?
High occupancy is a good sign, but it isn’t enough alone. Low ADR, high purchase prices, heavy seasonality, or strict regulations can still leave you with poor returns, so check each of them.
Is ADR or occupancy more important?
Neither works alone. RevPAR combines the two and gives a better view of revenue productivity, but it still leaves out costs, so it doesn’t tell you anything about profit.
How many Airbnb competitors should I analyze?
Use enough truly comparable properties to see a reliable performance range, not just the strongest listings. The right number depends on market size and property type, so adjust as you learn more.
Should I buy in a seasonal STR market?
You can, but your forecast must show that peak-season income covers fixed costs and the weaker months without unrealistic assumptions. Run your downside case before you decide.
Final STR Market Research Framework
Use the same order every time: legality, demand drivers, ADR plus occupancy plus RevPAR, seasonality, supply growth, submarket, operating costs, downside test, then property research. A fixed order keeps emotion out of the decision.
Legal feasibility → Demand drivers → ADR, occupancy and RevPAR → Seasonality → Supply growth → Submarket selection → Comparable set → Operating costs → Downside testing → Property-level underwriting
Don’t buy a property first and then try to prove the STR market works. Research the market first, find the submarkets and property types that perform, and only then start underwriting individual deals. Once you own a property, HOSTassis can help with guest messages and daily operations. You can also see our pricing. Book a free STR strategy call.